
When you’re investing hundreds of thousands of dollars in backup power, two questions dominate every specification review: How efficient is this generator? And how reliable will it be when I need it most?
What buyers should confirm first
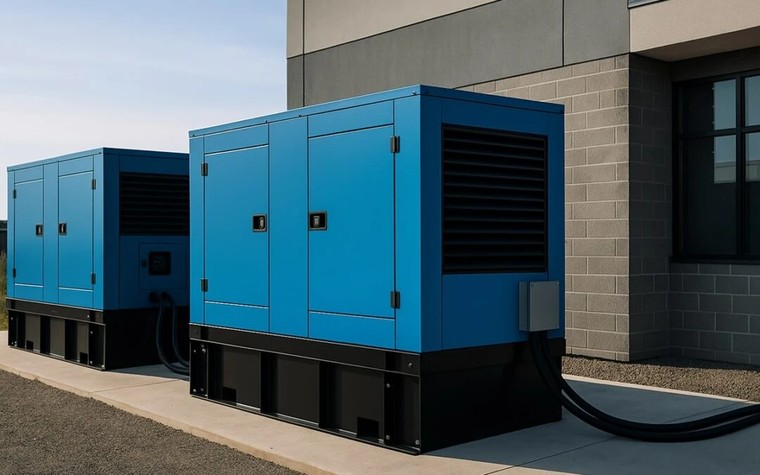
How Do Industrial Diesel Generators Compare in Fuel Efficiency and Reliability should be evaluated against the real load profile, voltage and frequency standard, duty rating, enclosure requirement, and installation environment before the order is confirmed.
Before requesting a quotation
- Confirm standby or prime duty and the expected running hours.
- Match site voltage, phase, and 50Hz or 60Hz requirement with the destination equipment.
- Check whether ATS, canopy, fuel tank, trailer, or remote monitoring are part of the same quote.
- Ask for the exact engine model, alternator model, controller type, and factory test scope.
Documents worth requesting
- Rated power table with standby and prime values clearly separated.
- Dimension and weight information for shipping, foundation, and room layout checks.
- Wiring diagram or ATS scope when the package includes switching equipment.
- Factory test record, packing list, and after-sales contact route for export support.
Related product resources
I’ve spent the last decade testing and comparing industrial diesel generators across dozens of installations. I’ve measured fuel burns at varying loads, tracked failure rates, and analyzed performance data from generators running in hospitals, manufacturing plants, and data centers. What I’ve learned is this: not all generators deliver what their spec sheets promise, and the differences in fuel efficiency and reliability can cost you—or save you—six figures over a generator’s lifespan.
Let me show you how to cut through marketing claims and evaluate what truly matters.
Understanding Fuel Efficiency in Industrial Diesel Generators
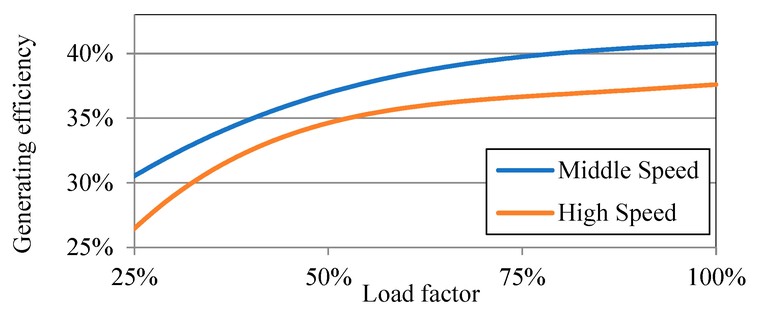
Fuel efficiency in generators isn’t a single number—it’s a performance curve that changes dramatically with load. Understanding this is critical because most generators spend operational time at partial loads, not full capacity.
The key metric is specific fuel consumption (SFC): gallons per kilowatt-hour (gal/kWh) or liters per kilowatt-hour (L/kWh). Lower numbers mean better efficiency. For modern industrial diesel generators, expect:
- 100% load: 0.28-0.30 gal/kWh (excellent efficiency)
- 75% load: 0.30-0.35 gal/kWh (still good)
- 50% load: 0.38-0.45 gal/kWh (efficiency drops noticeably)
- 25% load: 0.50-0.65 gal/kWh (poor efficiency, avoid sustained operation here)
Why does efficiency degrade at lower loads? Diesel engines achieve peak thermal efficiency when combustion chambers reach optimal temperatures and pressures. At light loads, incomplete combustion wastes fuel and can cause “wet stacking”—unburned fuel accumulating in the exhaust system, leading to maintenance problems.
Load factor is your most important planning variable. If you’re sizing a standby generator for a 400 kW peak load but typical outages only draw 200 kW (50% load factor), you’ll pay a 15-20% fuel efficiency penalty compared to operating at 75-80% load. This is why proper generator sizing matters tremendously for operational costs.
Let’s look at a real-world example. A 500 kW diesel genset running 200 hours annually:
- At 75% load (375 kW output): 75,000 kWh/year × 0.32 gal/kWh = 24,000 gallons/year
- At 50% load (250 kW output): 50,000 kWh/year × 0.40 gal/kWh = 20,000 gallons/year
Wait, the 50% load case uses less total fuel—but wastes more fuel per kWh delivered. Over 20 years at $4/gallon, choosing the right load factor can shift fuel costs by $100,000+.
Related Posts
What Affects Fuel Efficiency Beyond Load Factor
Several design and operational factors separate efficient generators from fuel-wasters.
Engine technology and design. Modern common-rail fuel injection systems, advanced turbocharging, and electronic governors deliver 5-8% better efficiency than older mechanical systems. Tier 4 emissions engines sometimes sacrifice 2-3% efficiency for emissions compliance (due to exhaust gas recirculation or aftertreatment), but the best manufacturers minimize this trade-off.
Engine displacement and configuration. Larger displacement engines (liters per cylinder) generally achieve better thermal efficiency but cost more and occupy more space. Six-cylinder inline configurations often outperform V-configuration engines in fuel economy due to better combustion chamber geometry, though V-engines offer more compact packaging.
Alternator efficiency. Premium alternators from Stamford, Leroy Somer, and Marathon achieve 95-97% efficiency, while budget units may drop to 90-92%. That 5% difference compounds over decades. Brushless alternators also reduce maintenance and improve long-term efficiency by eliminating wear-prone components.
Control system sophistication. Advanced digital controllers optimize engine speed, fuel delivery, and load management. Some systems implement “eco mode” that adjusts RPM based on load, saving 3-5% fuel during light-load operation. Brands like Tesla Power incorporate intelligent controls that monitor real-time efficiency and alert operators to suboptimal conditions.
Ambient conditions. Fuel efficiency degrades at high altitude (thin air reduces combustion efficiency) and extreme temperatures. Generators rated for high ambient temperature (50°C/122°F) often include oversized cooling systems that consume more parasitic power, reducing net efficiency by 2-4%.
Maintenance condition. Dirty air filters, worn injectors, incorrect valve clearances, and degraded fuel quality all reduce efficiency. A generator that delivered 0.30 gal/kWh when new might drift to 0.34 gal/kWh after 5,000 hours without proper service—a 13% efficiency loss that costs real money.
Understanding Reliability Metrics and What They Mean
Reliability isn’t subjective—it can be quantified and compared. Here are the metrics that matter.
Mean Time Between Failures (MTBF) measures average operating hours between unplanned failures requiring repair. For quality industrial diesel generators, expect:
- Standby duty (limited annual hours): 25,000-35,000 hours MTBF
- Prime duty (extended operation): 15,000-25,000 hours MTBF
- Continuous duty: 10,000-15,000 hours MTBF
MTBF varies by component. Engine blocks rarely fail; fuel injectors, turbochargers, and control modules are more common failure points. When manufacturers quote MTBF, verify whether it includes all components or just major assemblies.
Availability is the percentage of time a generator is capable of operating when called upon. Calculate it as:
Availability = (Total Hours – Downtime Hours) / Total Hours × 100%
For critical facilities, target 99.9% availability (less than 9 hours downtime per year). This requires not just reliable equipment but also responsive service networks and parts availability.
Load acceptance capability measures how quickly and cleanly a generator can handle sudden load increases without voltage/frequency excursions. Quality generators accept 100% rated load in a single step with voltage dip less than 15% and recovery within 5-10 seconds. Poor performers may take 15-30 seconds to stabilize, causing equipment trips.
Step-load performance is critical for facilities with motor starts or variable loads. Testing involves applying 50% or 100% load instantly and measuring voltage sag, frequency dip, and recovery time. Generator performance testing to ISO 8528-5 standards provides apples-to-apples comparisons.
Voltage and frequency regulation under varying load affects sensitive equipment. Look for:
- Steady-state voltage regulation: ±1% or better
- Transient voltage regulation: ±10% with recovery in <5 seconds
- Frequency regulation: ±0.25% steady-state, ±5% transient
Engine overhaul intervals indicate design robustness. Industrial engines should reach 20,000-30,000 operating hours before major overhaul (piston replacement, crankshaft machining, etc.). Consumer-grade engines may need overhaul at 10,000-15,000 hours—doubling lifecycle maintenance costs.
Comparing Major Brands and Engine Platforms
Let’s evaluate the diesel generator brands that dominate industrial installations and how their engine choices affect performance.
Cummins-powered generators are ubiquitous in North America. Cummins engines (especially QSK, QST, and QSX series) deliver excellent fuel efficiency (0.29-0.32 gal/kWh at 75% load for modern Tier 4 units) and proven reliability. MTBF typically exceeds 25,000 hours. Cummins’ extensive service network is a major advantage—parts and technicians are available almost anywhere. Overhaul intervals reach 30,000 hours with proper maintenance.
Perkins engines (owned by Caterpillar) power many generators in Europe and Asia. The 4000 and 2000 Series engines are workhorses, achieving 0.30-0.34 gal/kWh efficiency. Reliability is excellent (20,000+ hour MTBF), and global service support is strong. Perkins engines tend to be competitively priced while maintaining quality, making them popular for cost-conscious projects that won’t compromise performance.
Volvo Penta engines excel in marine and industrial applications where durability under harsh conditions is paramount. TWD and TAD series engines deliver 0.29-0.32 gal/kWh with exceptional build quality. Reliability metrics are outstanding—MTBF often exceeds 30,000 hours. Volvo Penta’s dealer network is more selective but highly trained. These engines command premium pricing justified by longevity.
MTU engines (Mercedes-Benz brand) represent the high end of industrial power. Series 4000 and 2000 engines achieve 0.28-0.30 gal/kWh—among the best in the industry—with MTBF approaching 35,000 hours. MTU’s electronic controls are sophisticated, optimizing performance across load ranges. Expect to pay 20-30% more than comparable Cummins units, but lifecycle costs often favor MTU due to efficiency and reliability.
Doosan and Deutz engines serve mid-market segments with solid performance at attractive prices. Expect 0.32-0.36 gal/kWh efficiency and 18,000-22,000 hour MTBF. These engines work well for non-critical applications where budget constraints are significant.
Chinese engine brands (Weichai, Shangchai, etc.) have improved dramatically but still trail Western manufacturers in efficiency (0.35-0.40 gal/kWh) and reliability (15,000-18,000 hour MTBF). Service networks outside Asia are limited. Consider these for non-critical backup applications where initial cost is the primary driver.
Alternator pairings matter as much as engines. Top manufacturers pair quality engines with proven alternators:
- Stamford (Cummins Generator Technologies): Industry standard, 96-97% efficiency, excellent voltage regulation
- Leroy Somer: Premium French brand, exceptional in harsh environments, 96-97% efficiency
- Marathon: North American leader, robust construction, 95-96% efficiency
Generators using off-brand alternators often experience voltage regulation issues, premature bearing failures, and lower efficiency. Don’t compromise here—the alternator affects every aspect of power quality.
Companies like Tesla Power carefully engineer engine-alternator pairings, matching torque curves and thermal characteristics to optimize load factor efficiency across the operating range. This systems-integration approach delivers real-world performance that exceeds simply bolting premium components together.
Testing and Verification Tools
Don’t trust manufacturer claims—verify performance independently.
Load bank testing is essential for new generators and annual validation. A load bank simulates electrical load, allowing you to measure:
- Fuel consumption at 25%, 50%, 75%, and 100% load
- Voltage and frequency stability
- Exhaust temperature and emissions
- Step-load acceptance (applying sudden load increases)
Reputable manufacturers provide witnessed factory acceptance tests (FAT) before shipment. Insist on this for generators over 250 kW. You or your consultant should attend, taking independent measurements to verify spec compliance.
ISO 8528 testing standards provide the framework for generator performance testing:
- ISO 8528-1: Definitions and specifications
- ISO 8528-5: Generator set performance (the critical one for fuel efficiency and load acceptance)
- ISO 8528-9: Acoustic measurements
- ISO 8528-12: Emergency power supply
Generators claiming ISO 8528 compliance should provide certified test reports from accredited labs. If a manufacturer can’t produce these, be skeptical.
Field monitoring and data logging tracks real-world performance. Modern generators with telemetry allow you to monitor:
- Fuel consumption per kWh over time (detecting efficiency drift)
- Runtime hours at various load levels
- Temperature, pressure, and vibration trends (predictive maintenance)
- Fault codes and alarm history
Cloud-based monitoring platforms from manufacturers like Tesla Power enable remote diagnostics, reducing service callouts and catching problems before they cause failures.
Third-party certification agencies provide independent validation:
- UL 2200: Safety and performance standards for stationary generators
- CSA: Canadian Standards Association certification
- CE marking: European conformity for generators sold in EU markets
These aren’t just paperwork—they represent audited performance tests and quality systems.
Fuel flow meters and energy meters installed during commissioning create your own efficiency baseline. Compare actual consumption against manufacturer curves quarterly. Significant deviation signals maintenance needs or equipment problems.

Optimizing Generator Performance for Your Application
Even the most efficient generator underperforms if poorly applied. Here’s how to optimize.
Right-size your generator. Target 70-80% load during typical operation. Oversizing saves on initial capital but costs dearly in fuel over decades. Undersizing risks voltage sags and premature wear. Use detailed load profiles—not just peak demand—for sizing decisions.
Consider modular or parallel configurations. Instead of one 2 MW generator, install two 1 MW units. Run one during moderate loads, both during peaks. This keeps load factors in the efficient 70-85% range. Parallel operation also improves reliability through redundancy (N+1 configuration).
Implement load management. Automated load shedding sequences non-critical loads to keep generators in efficient operating zones. Priority-based load switching ensures critical systems get power first while maintaining optimal generator loading.
Schedule regular load bank testing. Monthly 30-minute runs at 30-50% load prevent wet stacking and keep engine components exercised. Quarterly load bank tests to 75-100% load verify capacity and provide efficiency data. Generators that sit idle for months and then fail during outages are distressingly common.
Monitor and act on efficiency trends. Track diesel genset fuel consumption per kWh monthly. When efficiency degrades 5-10%, investigate: dirty air filters, injector fouling, incorrect fuel quality, valve clearances, or turbocharger issues. Catching problems early prevents major failures.
Maintain fuel quality. Diesel fuel degrades over time, especially in humid climates where water contamination is common. Implement fuel polishing systems that circulate and filter stored fuel, removing water and biological growth. Poor fuel quality reduces efficiency 3-8% and causes injector failures.
Optimize for local conditions. At high altitude, expect 3-4% power derate per 1,000 feet above sea level. Spec generators with altitude compensation or larger displacement to maintain rated output. In high-temperature climates, ensure adequate cooling capacity—inadequate radiators cause thermal derating and efficiency losses.
Train operators properly. Many reliability problems trace to operator error: incorrect startup/shutdown sequences, ignoring alarms, skipping pre-start checks. Invest in comprehensive training for anyone who touches the generator.
Conclusion: Making Data-Driven Generator Decisions
Comparing industrial diesel generators on fuel efficiency and standby generator reliability requires moving beyond spec sheets to real-world data and rigorous testing.
Key takeaways:
- Fuel efficiency varies dramatically with load—optimize sizing for 70-80% typical operation
- Look for SFC of 0.30-0.32 gal/kWh at 75% load from quality manufacturers
- MTBF over 25,000 hours indicates robust industrial-grade construction
- Engine brands matter: Cummins, Perkins, Volvo Penta, and MTU deliver proven performance
- Alternator quality (Stamford, Leroy Somer) is equally critical for reliability and efficiency
- Independent load bank testing verifies manufacturer claims
- Proper application and maintenance preserves efficiency and prevents premature failures
Manufacturers like Tesla Power distinguish themselves through systems engineering—optimizing engine-alternator integration, incorporating intelligent controls, and supporting customers with data-driven performance monitoring. This holistic approach delivers efficiency and reliability that justify premium positioning.
Your generator investment will run for 20-30 years. Spending time upfront to verify fuel efficiency and reliability data, rather than accepting marketing claims, pays compound returns through reduced generator operating costs and maximized uptime.
Choose based on data, not promises.
Frequently Asked Questions
What is considered good fuel efficiency for an industrial diesel generator?
Modern industrial generators should achieve 0.28-0.32 gallons per kilowatt-hour (gal/kWh) at 75% load, which is the typical operating point for well-sized installations. At 100% load, expect 0.28-0.30 gal/kWh from premium units. Efficiency degrades at partial loads—0.35-0.45 gal/kWh at 50% load is normal. Generators using Tier 4 emissions engines may see slightly higher consumption (2-3%) compared to Tier 3 units due to exhaust aftertreatment systems. If a generator consumes more than 0.35 gal/kWh at 75% load, it’s inefficient by today’s standards and will cost significantly more to operate over its 20+ year lifespan.
How do I compare reliability between different generator brands?
Focus on quantifiable metrics rather than marketing claims. Request MTBF (Mean Time Between Failures) data—quality industrial generators should exceed 25,000 operating hours between unplanned failures. Ask for step-load acceptance test results per ISO 8528-5 standards, showing how quickly voltage and frequency recover after sudden load changes. Review engine overhaul intervals (look for 25,000-30,000 hours before major service). Check alternator specifications—Stamford, Leroy Somer, and Marathon alternators indicate quality. Request customer references in similar applications and verify service network coverage in your region. Independent load bank testing during factory acceptance provides objective performance validation.
What’s the difference between standby, prime, and continuous power ratings?
Standby rating is maximum emergency power available for up to 200 hours annually, with typical use limited to 25-hour durations. It represents peak capacity during utility outages. Prime rating (typically 85-90% of standby rating) is maximum power available for unlimited hours annually with variable loading—used when grid power is unavailable or unreliable for extended periods. Continuous rating (typically 70-80% of standby) is baseload power available 24/7 at constant load. Using a generator above its designated rating accelerates wear, increases fuel consumption, and voids warranties. Size your generator for the correct duty cycle—don’t run standby-rated units in prime applications or you’ll face premature failures and efficiency losses.
How often should industrial diesel generators be load bank tested?
Monthly exercise runs (30 minutes at 30-50% load minimum) prevent wet stacking and keep components exercised. Quarterly load bank tests to 75-100% rated capacity verify actual performance and catch developing problems before they cause failures. Annual comprehensive tests including step-load acceptance, fuel consumption measurement, and emissions verification provide detailed performance baselines. After major maintenance (injector replacement, turbocharger service, overhauls), full load testing validates work quality. Critical facility generators (hospitals, data centers) should undergo monthly 100% load tests to ensure readiness. Without regular load bank testing, generators often fail during actual emergencies because problems go undetected during light-load exercise runs.
What causes fuel efficiency to degrade over time in diesel generators?
Several factors compound to reduce efficiency: Dirty air filters restrict airflow, causing incomplete combustion (3-5% efficiency loss). Fouled fuel injectors create poor spray patterns, wasting fuel (5-8% loss). Incorrect valve clearances reduce compression efficiency (2-4% loss). Turbocharger wear decreases boost pressure, reducing power density (4-6% loss). Degraded fuel quality from water contamination or biological growth impairs combustion (3-8% loss). Exhaust system restrictions from carbon buildup increase back pressure (2-3% loss). Control system drift in older mechanical governors affects fuel delivery optimization (2-4% loss). Proper preventive maintenance—oil and filter changes every 250-500 hours, injector cleaning/replacement, valve adjustments, and fuel polishing—preserves factory efficiency. Monitoring fuel consumption per kWh monthly detects degradation early, allowing targeted maintenance before efficiency losses become severe.